Visualizing Sound
Hi, I am Conan, a programmer in New York. I taught myself DJing. After awhile I started to look into music theories and DAW (Ableton Live 9 in my case), I wish I can play my own works in parties one day. I think the course Introduction to Music Production is a perfect starting point for music production. I am looking forward to learning from Loudon and you guys and gals. English is not my mother tongue, please bear with me..
This blog is for the week 1 lectures assignment. I would not consider this as teaching, this one will be more like a reviewing and reflecting.
Study
Why
Let us start with why. Why do we need sound visualization? I think the point of sound visualization is to make vague problem clear. Sound has many aspects, in the first few lectures, we have learnt three essentials of them: propagation, amplitude, and frequancy. I didn’t include timbre here is because that timbre is a combination of different frequencies, it doesn’t sound like a essential to me. Another implicit essential about sound is time, I have to mention it because it will be one axis in some of our diagrams. When we are looking at a problem, we want to easily grasp the global overview, and at the meanwhile maintain the precision. Luckily that mathematician and physicist has already built some handy tools (in here I considered a data representation methodology as a tool, but not a specific software).
A good case study would be DJing. When you are performing, we want to get the overview of the track, quickly. You can of course hearing/scanning the next track with your headphone, but it is just not good enough and quick enough. I personally rely on the waveform display a lot. The following screenshot is from Serato DJ’s waveform section.
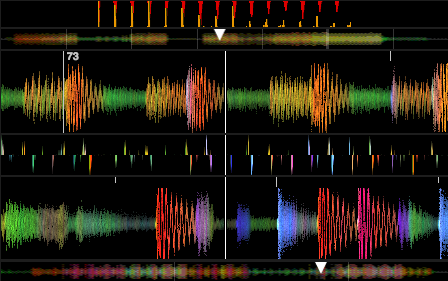
From the waveforms’ shape, I can tell:
- where are the kicks, hi-hats, and vocals
- section of the track
From the color of the waveforms, I can tell how the EQ changes cross the track. Quote from the Serato site:
The EQ Colored waveform option changes the waveform colors in Serato DJ to reflect your EQ changes. For example, taking out the bass will remove all the red from the waveform, taking out the high end will remove all the blue and taking the midrange out will remove all the green.
What
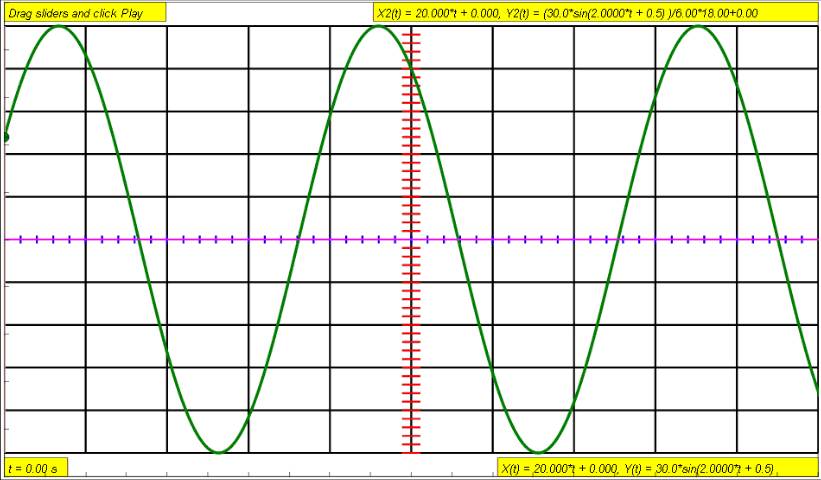
What are these tools as in diagrams? The first is Oscilloscope. It is only showing two aspects of sound: amplitude (Y axis) and time (X axis). The larger the range of Y axis, the higher the amplitude. For the time axis, the time window usually will be few millisecond in our case.
Frequency is also in the diagram, it is just implicit. The following animation is from Oscilloscope wikipedia page. You can see that within the same period of time, the more dense the waveform, the frequency is higher.
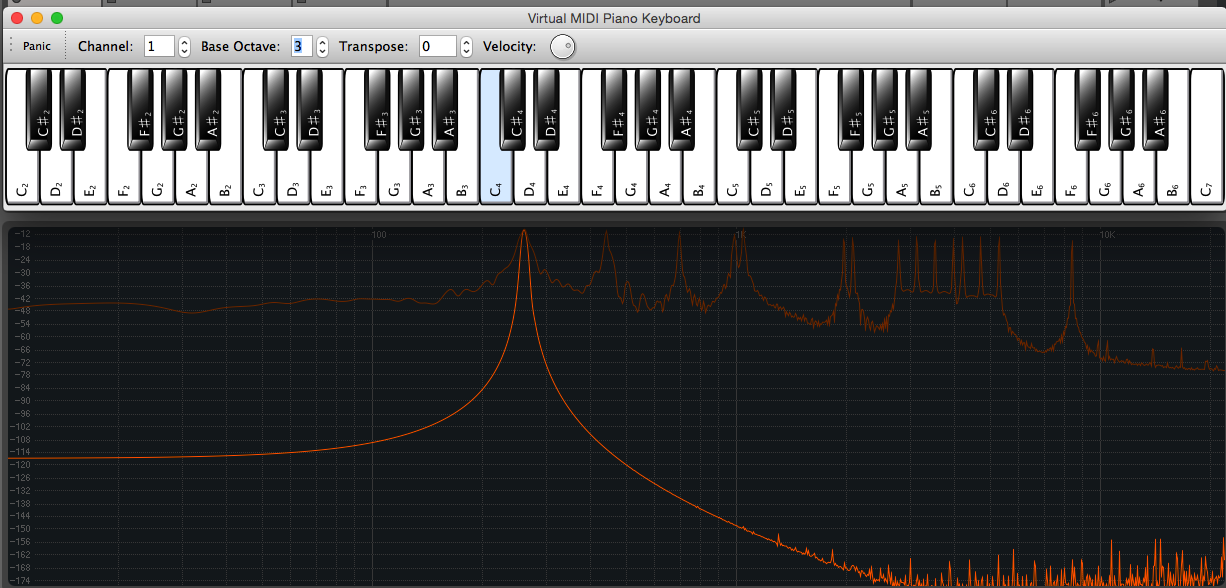
The next is spectrum analyzer. In the oscilloscope diagram, we can only observe relative frequency change, it cannot describe the frequency aspect accurately. We use spectrum analyzer for this. This time, the X axis is frequency and the Y axis is the amplitude. Remember Loudon mentioned that when people talking about 1K, 2K, 5K, we should have some idea on mapping these numbers to our hearing? I actually did try to feel the numbers. What I did is playing note using a Sin synth, which is also hooked to a spectrum analyzer. Here is what I found:
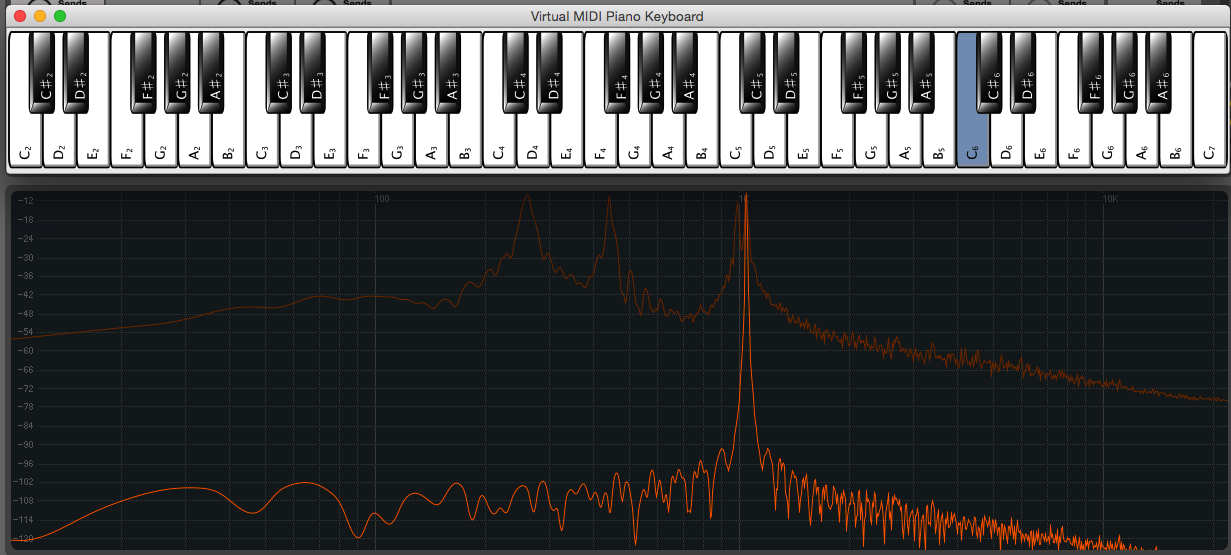
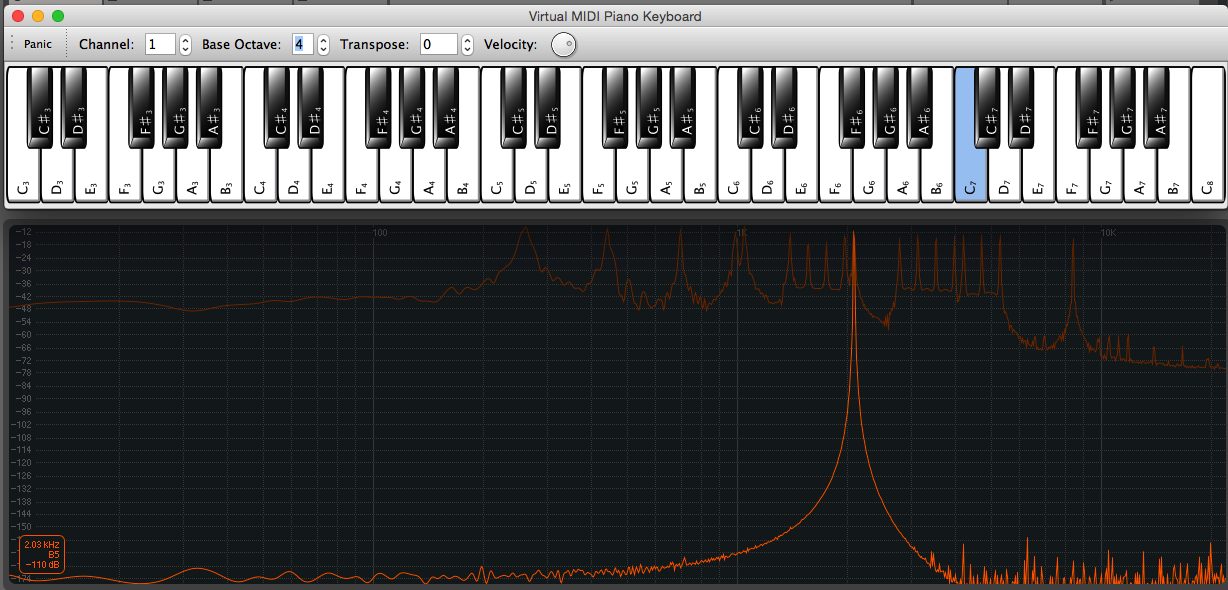
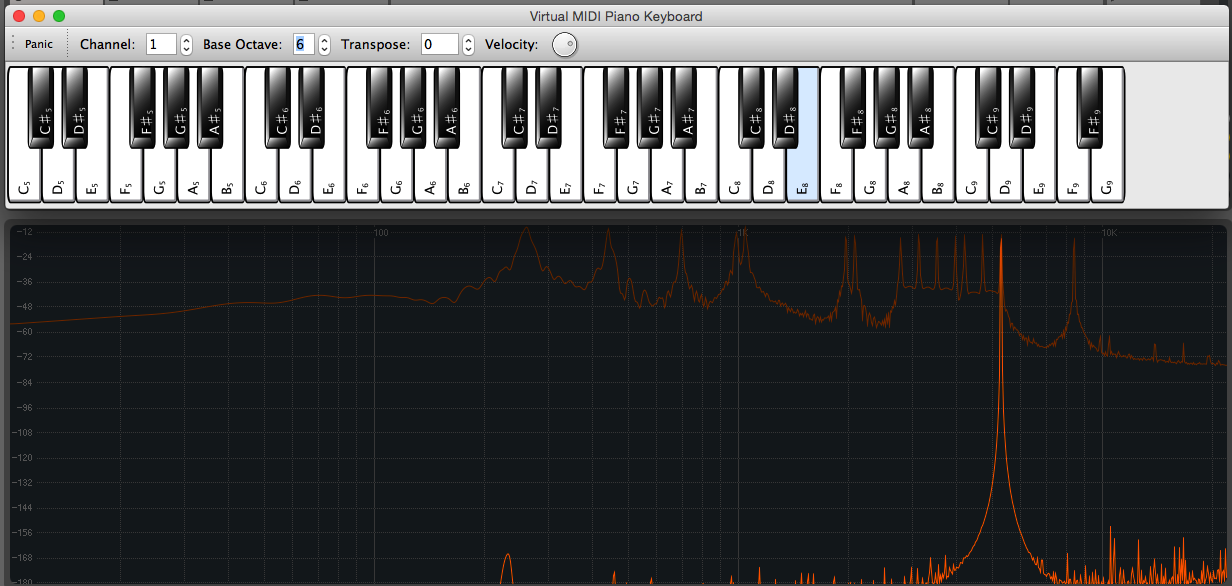
So what is middle c (C4) frequency?
The last one is Sonogram. The spectrum diagram is like a snapshot of the sound in that moment. We could not tell the changes over time. We use sonogram to see these dynamics. In sonogram, the X axis is the time, and the Y axis is the frequency. The third dimension is amplitude, which is represented by color.
Reflection
Before the course, I never actually pay much attention on the waveforms. until after then, I realized I actually rely on waveforms or sound visualization a lot. In the post, I not only reviewed the things we have learnt, but also spent some time to explain my use case as a case study. To do that, I actually need to dig into the Serato DJ software manual. Just want to make sure the information I have provided is accurate. I have also tested the spectrum in my DAW. A lot of things are just making more sense now.
That is about it. Thank you for your reading, and you are welcome to leave feedback and criticize.
Extra
While I am searching around about sound visualization, I found an amazing video clip:
CYMATICS: Science Vs. Music - Nigel Stanford from Nigel Stanford on Vimeo.
With the knowledge of the first 4 lectures and basic physics, we should be able to reveal the secrets in this video.
Here are the hints: vibration, longitudinal wave, camera ;)
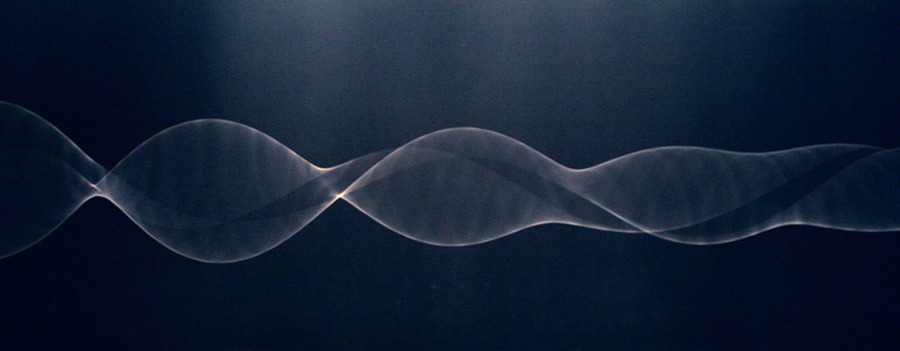
Cover image copyright by Daniel Palacios